Zooming In on Burn Scars: The Science Behind PM2.5
Last updated: 6 Feb 2026 | 210 Views |

Zooming In on Burn Scars:
The Science Behind PM2.5
Agricultural Field Fires, Nakhon Nayok Province — January 28, 2026
In late January, news reports highlighted extensive agricultural burning across tens of thousands of rai in Nakhon Nayok Province. This period coincided with a seasonal “air stagnation” condition, when atmospheric ventilation is low. As a result, PM2.5 concentrations in nearby provinces—including Bangkok and the metropolitan area—rose to red-level air quality alerts, causing widespread and unavoidable health impacts.
This raises a key question:
Can satellites help analyze agricultural burning, and if so, how?
Let’s zoom in on the technical side—step by step, in an easy-to-understand way.
Choosing the Right Satellite Data
The first step is selecting appropriate satellite imagery. In general, satellite data can be divided into two main categories:
- High-resolution satellites: provide very detailed imagery but usually require purchasing data.
- Medium-resolution satellites: freely available but require more computational effort for data processing.
One of the most widely used examples is Sentinel-2, which offers a spatial resolution of 10 × 10 meters per pixel (each pixel represents 100 square meters). This resolution is well suited for detecting burn scars in agricultural fields with reasonable accuracy.
Standard Burn Scar Analysis: From Pre-Fire to Post-Fire
The standard approach to burn scar analysis involves comparing satellite images before the fire (pre-fire) and after the fire (post-fire) over the same area and time period. Optical satellite data such as Sentinel-2 or Landsat are commonly used because they clearly capture changes in land surface characteristics.
The workflow typically includes:
1. Cloud and cloud-shadow masking
Removing clouds and their shadows is essential to ensure clean and reliable imagery.
2. Burn-sensitive index calculation
A commonly used index is the Normalized Burn Ratio (NBR), which exploits changes in reflectance between two spectral bands:
- NIR (Near-Infrared): Healthy vegetation reflects strongly; reflectance decreases after burning.
- SWIR (Shortwave Infrared): Burned or dry surfaces tend to reflect more strongly.
The formula is:
NBR = (NIR − SWIR2) / (NIR + SWIR2)
3. Change detection (dNBR)
Burn severity is assessed by calculating the difference between pre- and post-fire NBR values:
dNBR = NBR_pre − NBR_post
In general, higher dNBR values indicate a greater likelihood of burned areas or more severe burning.
Mapping and Validating Burned Areas
Once dNBR values are calculated, several approaches can be used:
- Threshold-based classification to extract burned pixels and generate burn scar maps
- Machine learning methods to improve classification accuracy and processing speed
- Removing small noisy pixels
- Grouping pixels into polygons
- Summarizing burned areas in terms of total size (e.g., rai), by province or district
In cases where cloud cover is heavy, radar satellites such as Sentinel-1 can be used to support the analysis, as radar signals can penetrate clouds. Finally, validation using hotspot data or ground observations is essential to ensure the results are reliable.
Now, let’s look at the results from this case study.

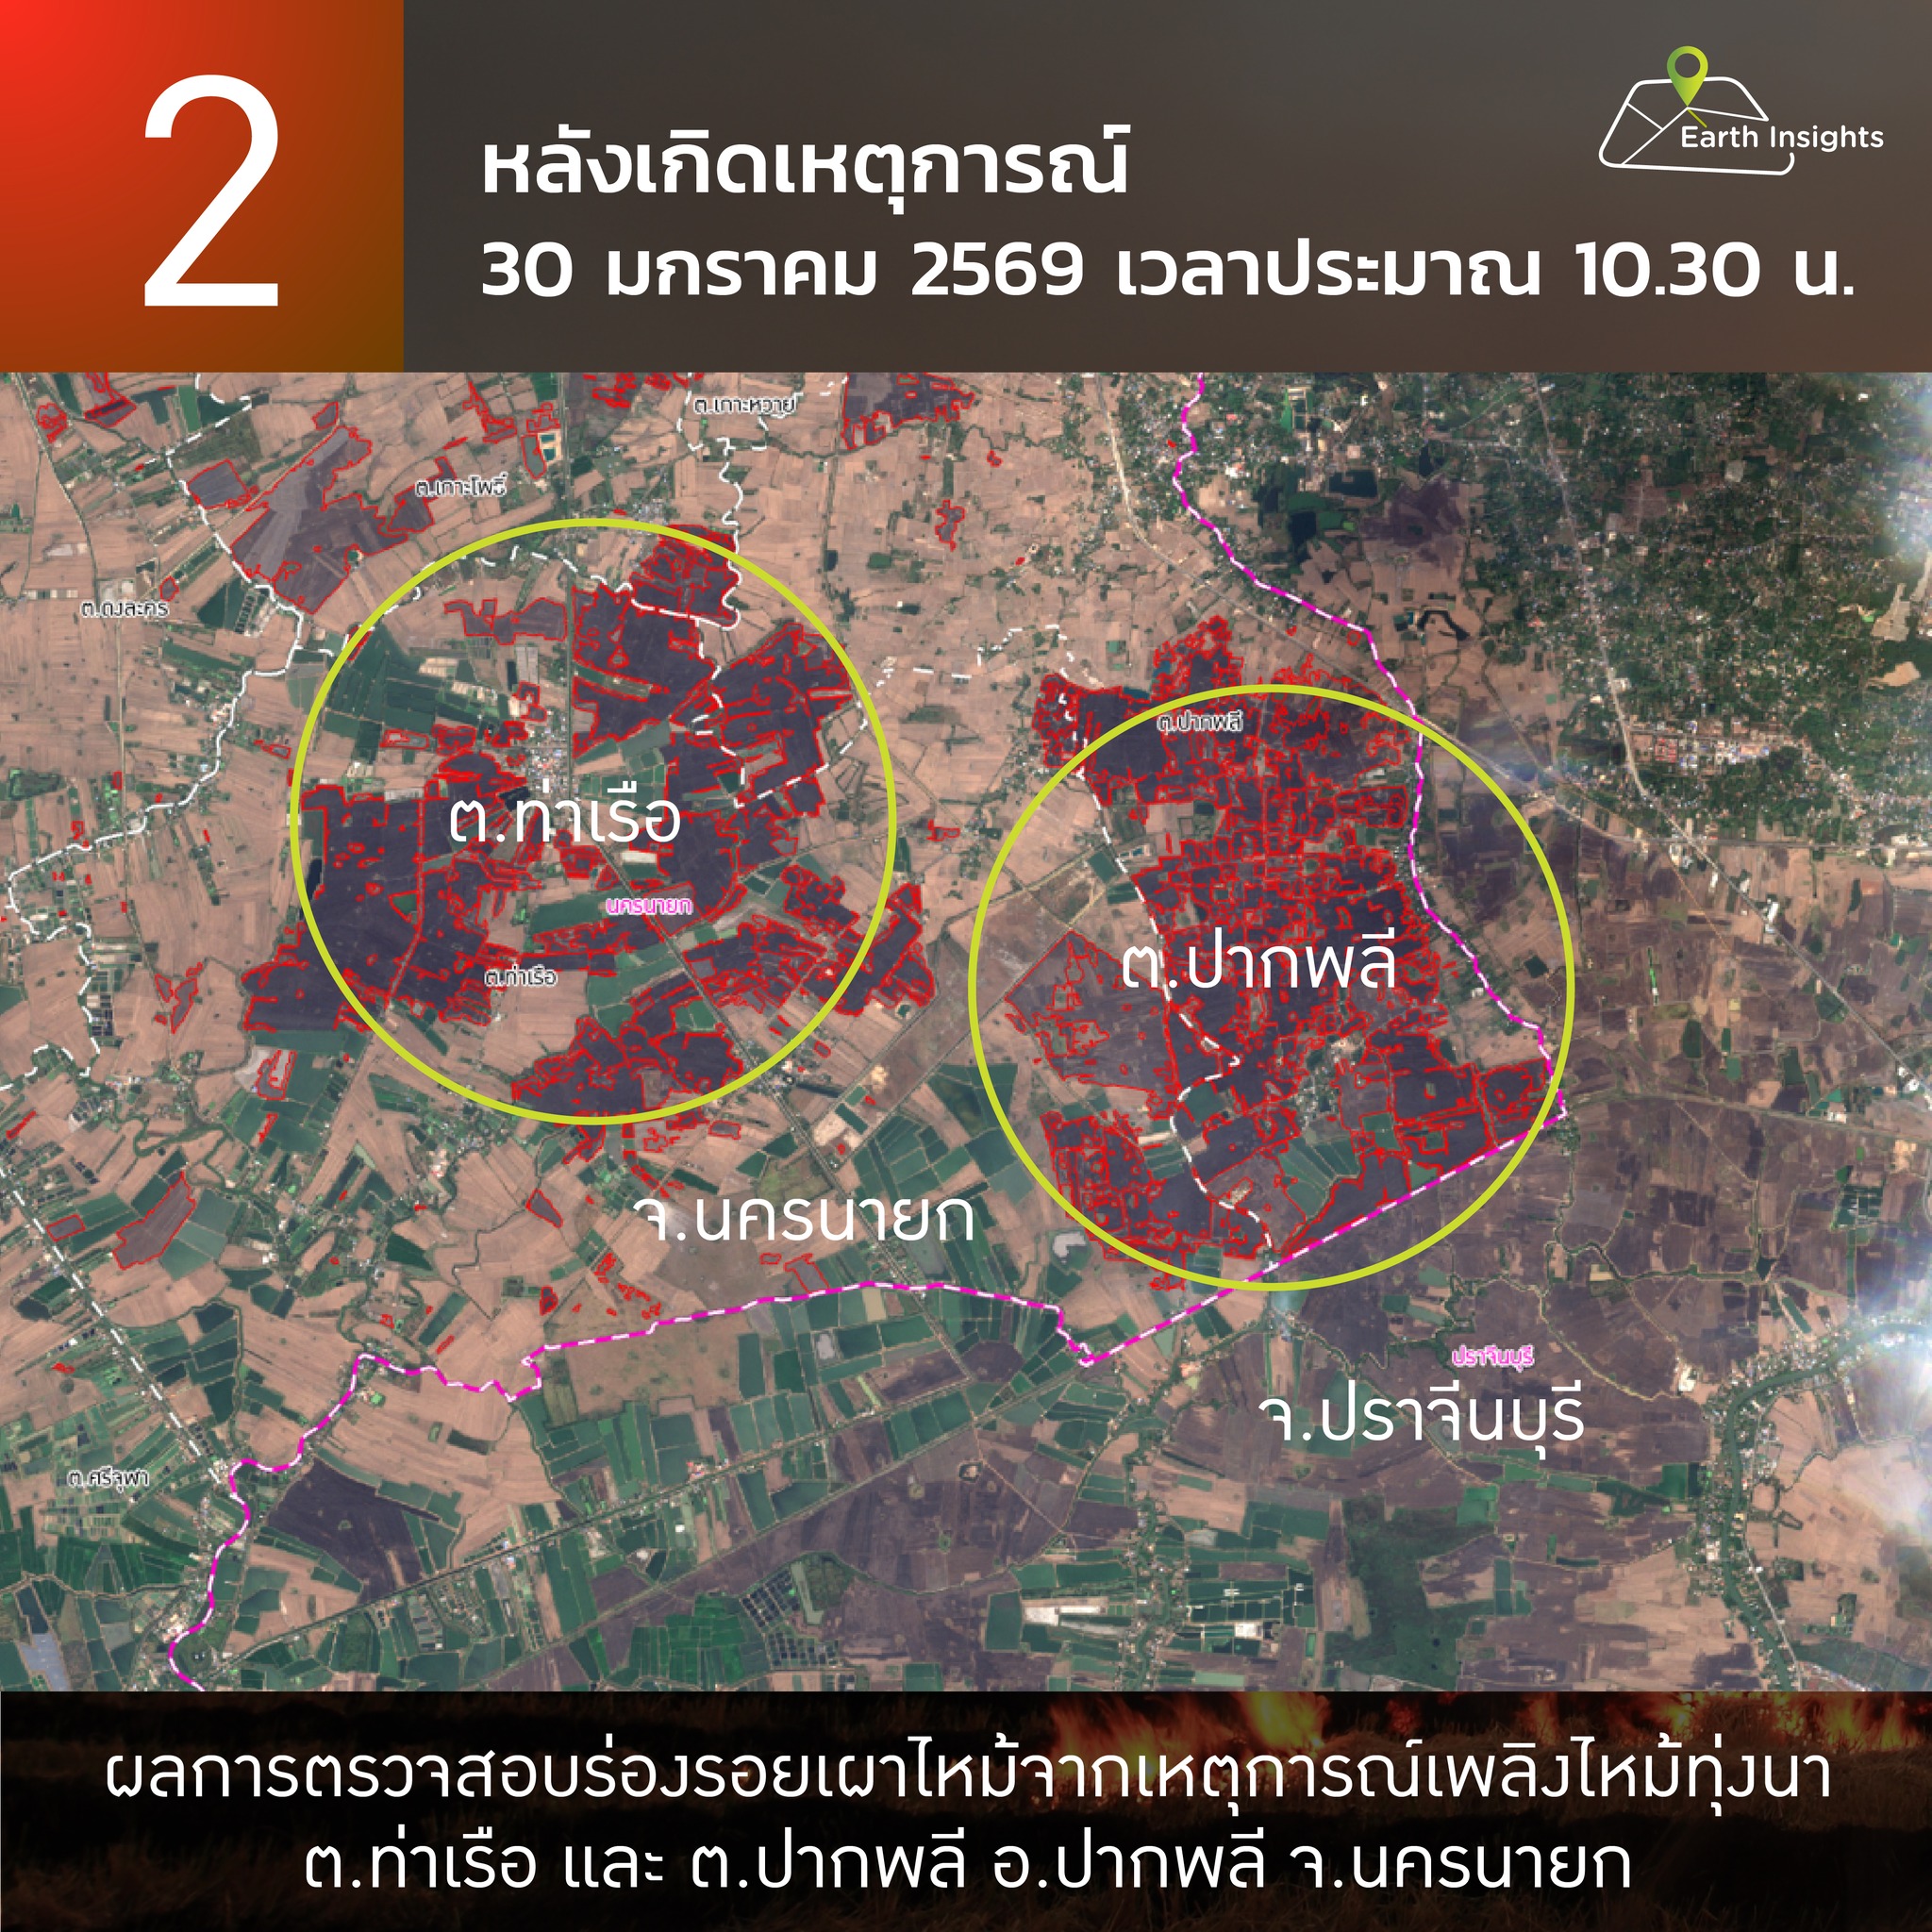
Results from Nakhon Nayok
When compared with Figure 2, dated January 30, 2026, a clear increase in burned areas is visible. Importantly, the analysis allows us not only to pinpoint exact locations, but also to calculate the size of burned areas quantitatively.
An Open Scientific Question
Interestingly, satellite imagery also reveals burn scars in neighboring provinces that had not been widely reported in the news. This leads to an important scientific question:
Did the fire spread from adjacent provinces, or did it originate independently within Nakhon Nayok itself?
Answering this requires further scientific investigation, particularly time-series analysis to reconstruct the sequence of events and establish evidence-based conclusions.


